Overview
The Comparison tab is your central workspace for evaluating vendors in Olive. Once vendors have submitted their responses to your RFP, this is where you bring them together — comparing their answers side by side, scoring their responses, reviewing pricing, and collaborating with your team to make a well-informed decision.
The Comparison tab has two sub-tabs:
|
Sub-tab |
Purpose |
|
Responses |
Compare vendor responses to your requirements, score them, and discuss them with your team |
|
Pricing |
Compare vendor costs over time and score their pricing |
Responses Sub-tab
Click the Responses sub-tab to start evaluating vendor answers. The page is split into two areas: the Vendor Column on the left, and the Comparison Table on the right.
Vendor Column
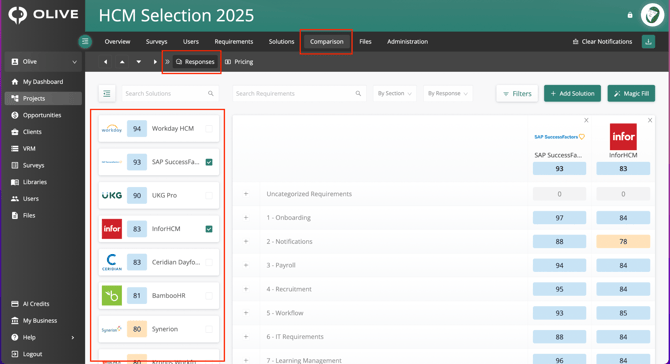
The Vendor Column — all project vendors ranked by their overall score
The Vendor Column lists every vendor in your project, ranked from highest to lowest overall score. The number next to each vendor's name is their score out of 100, calculated from the responses they've submitted and the scores your team has assigned.
To add a vendor to the Comparison Table, tick the checkbox next to their name. You can select multiple vendors at once.
|
💡 Tip: Start by comparing your top 2–3 vendors for a cleaner, more focused view. You can always swap vendors in and out. |
Comparison Table
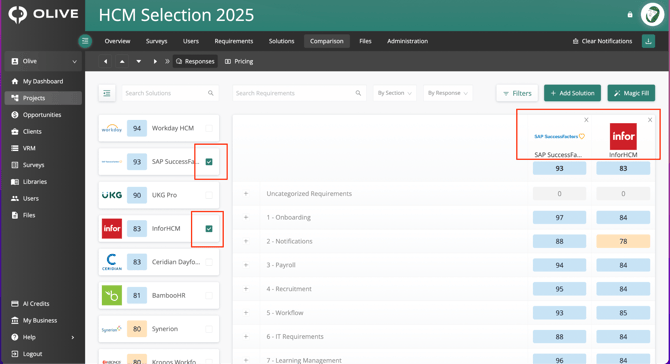
Selecting vendors populates the Comparison Table with their data
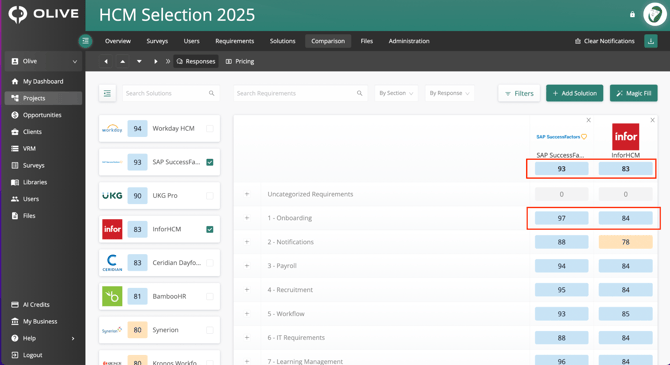
The Comparison Table showing overall and section-level scores per vendor
Once you select vendors, they appear as columns in the Comparison Table. At the top of each vendor's column you'll see their overall score. Below that, each requirement section (e.g. Onboarding, Payroll, Security) shows a section-level score, giving you a clear picture of where each vendor is strong or weak.
Click on a section name to expand it and view the individual requirements underneath, along with each vendor's response type:
|
Response type |
What it means |
|
Core |
Fully included in the vendor's standard product |
|
Configurable |
Available but requires setup or configuration |
|
Third-Party |
Requires an additional tool or integration |
|
Not Applicable |
Not relevant to this vendor's offering |
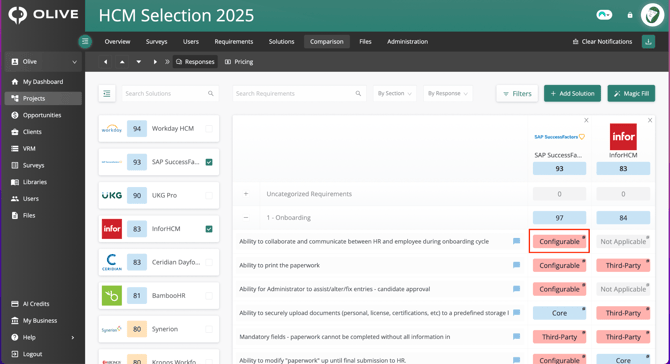
Expanded section showing individual requirements and each vendor's response
|
💡 Tip: A low score in a section that's critical to your organisation is worth investigating further — click into those sections first. |
Response Modal
To dive deeper into a vendor's answer for a specific requirement, click on their response label (e.g. 'Configurable' or 'Core') in the Comparison Table. This opens the Response Modal — a panel on the right side of the screen where you can score the response, read the vendor's description, discuss it with your team, and flag it for follow-up.
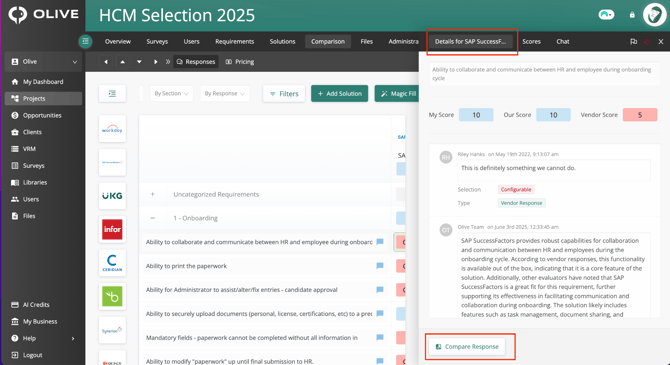
The Response Modal — Details tab showing the vendor's response, scores, team chat, and Compare Response button
Details Tab
The Details tab shows the vendor's selected response option and any description or notes they've provided. From here you can:
- My Score — enter your personal score for this response
- Our Score — the average score given by all team members for this response
- Vendor Score — the default score pre-assigned to the vendor's chosen response option
At the top of the Response Modal you'll also find two flagging options:
- Add Agenda Item — flag this response to discuss during a vendor demo or meeting
- Mark as Reviewed — mark the response as evaluated so your team knows it's been covered
|
💡 Tip: Use 'Mark as Reviewed' consistently across your team so everyone can see evaluation progress at a glance. |
Scores Tab
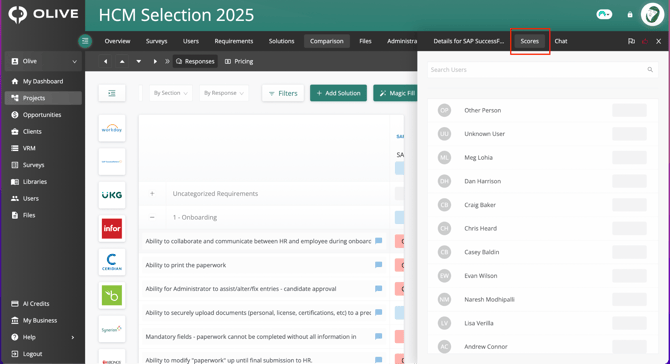
The Scores tab — showing individual scores from each team member
The Scores tab lists every team member in the project alongside the score they've individually given for this response. Use this to spot where your team agrees — or disagrees — on a vendor's answer.
Chat Tab
The Chat tab is where you can discuss a specific vendor response with your internal team. You can also share the response directly with the vendor using the 'Share with Vendor' feature.
- Type your comment in the text box at the bottom
- Click the Send icon to post it
- Edit or Delete your own comments using the options that appear on hover
Compare Response
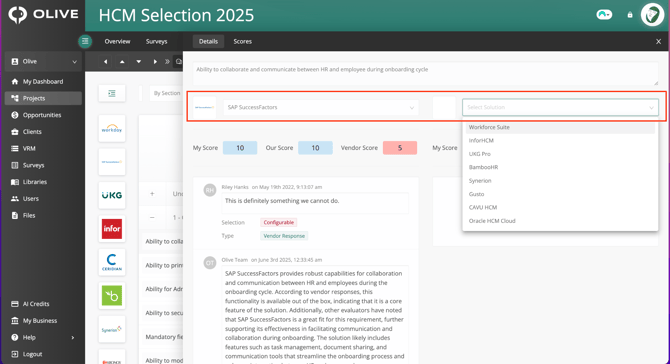
The Compare Response Modal — comparing two vendors' responses side by side
To compare two vendors' answers to the same requirement side by side, click the 'Compare Response' button at the bottom of the Response Modal's Details tab. Alternatively, hover over any requirement row in the Comparison Table and click the Compare button that appears.
A modal opens where you select a second vendor from a dropdown. Both vendors' responses, descriptions, and scores are displayed side by side, and you can enter your 'My Score' for each vendor directly from this view.
|
💡 Tip: Use Compare Response when two vendors have given similar answers — it makes it much easier to spot the differences. |
Requirement Modal
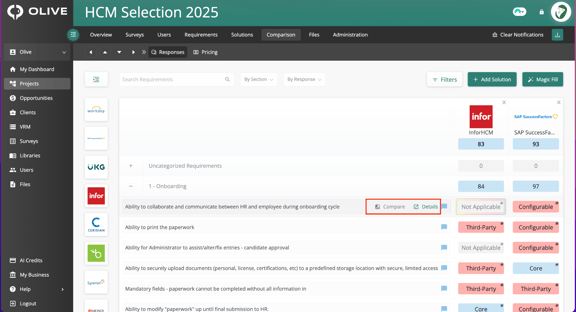
Hovering over a requirement row reveals the Compare and Details buttons
To view or edit the full details of a specific requirement, hover over its row in the Comparison Table and click the Details button. This opens the Requirement Modal — a dedicated panel for managing everything about that requirement.
The Requirement Modal contains five tabs:
|
Tab |
What you can do |
|
Details |
View the requirement text, change its section, set your star ranking, add or create tags, and write a description |
|
Ranking |
If you are a project Admin, see the star ratings every team member has given this requirement |
|
Chat |
Discuss the requirement with your internal team — post, edit, and delete comments |
|
Response |
Configure the response format vendors use to answer this requirement (Text, Score, Yes/No, Single Select, Multiple Select, Ranking, Number, Number Scale) |
|
History |
View a full log of every change ever made to this requirement |
Toolbar Features
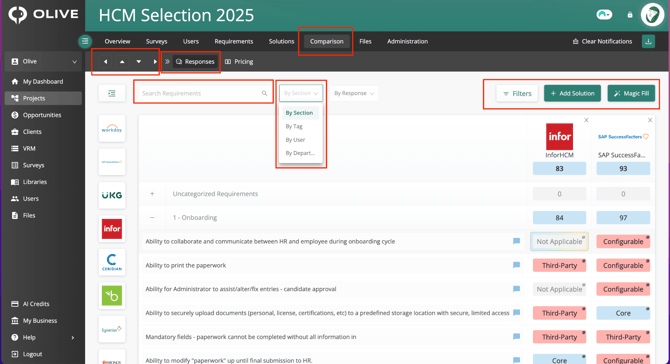
The Responses toolbar — Search, Display options, Filters, Add Solution, and Magic Fill
At the top of the Responses sub-tab, a toolbar gives you quick access to several features for managing and navigating the Comparison Table.
Search Requirements
Type a keyword in the Search Requirements box to instantly filter the Comparison Table to show only requirements that match your search. Clear the search to return to the full view.
Display Options
Use the 'By Section' dropdown to change how requirements are grouped in the Comparison Table:
- By Section — Default grouping by requirement section
- By Tag — Group by tags applied to requirements
- By User — Group by the user associated with each requirement
- By Department — Group by department
Filters
Click the Filters button to open the filtering modal. Use 'Add a Property to Filter' to narrow down which vendors and requirements are displayed. You can stack multiple filters at once. Click Clear Filter to reset all filters.
Add Solution
Click '+ Add Solution' to add a new vendor to your project. The Add Solution modal opens with three tabs:
- My Library — Search for and add a vendor already saved in your Olive library
- Add Solution — Add a brand-new vendor by entering their solution name, company name, and website. Olive will suggest matching vendors as you type.
- Recommend — Opens the Ask Olive AI chatbot, which analyses your current requirements and vendors and recommends additional solutions to consider. You can ask it to add recommendations directly to your project.
|
💡 Tip: On the Recommend tab, you can ask Olive's AI to add suggested solutions to your project in one step — no need to add them manually. |
Magic Fill
Click Magic Fill to have Olive's AI automatically generate responses for all requirements using publicly available information about each vendor. This is useful for populating responses before a vendor has submitted their own answers.
|
⚠️ Important: Magic Fill responses are AI-generated from public sources and are not provided directly by vendors. Always verify AI-generated responses before using them to make final decisions. Any responses that cannot be found will be left blank, and your AI credits will be reimbursed for those. |
Navigation Arrows
Use the Left, Up, Down, and Right arrow buttons at the top-left of the page to scroll through the Comparison Table in the corresponding direction — helpful when working with a large number of requirements or vendors.
Pricing Sub-tab
Click the Pricing sub-tab to compare vendor costs side by side. Like the Responses sub-tab, vendors are listed on the left — tick their checkbox to include them in the pricing comparison on the right.
Years to View
At the top right of the page, enter the number of years you want to compare in the 'Years to View' field and click Calculate. All charts and the Cost Estimates table will update to reflect the selected period.
Cost Per Year Comparison
This bar chart shows the annual cost for each selected vendor across the number of years you've chosen. It helps you see how a vendor's costs change from year to year and compare annual spend across vendors at a glance.
Cumulative Cost Comparison
This line chart shows the total accumulated cost for each vendor over the selected period. Use it to understand the long-term financial commitment of choosing one vendor over another.
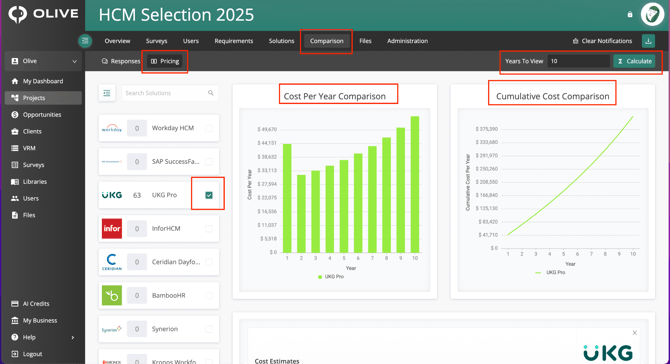
The Pricing sub-tab — Cost Per Year Comparison and Cumulative Cost Comparison charts
|
💡 Tip: Look at the Cumulative Cost chart to compare Total Cost of Ownership (TCO) — the total you'll spend over the entire contract period. This gives you the clearest picture of what each vendor will actually cost your organisation over time. |
Cost Estimates Table
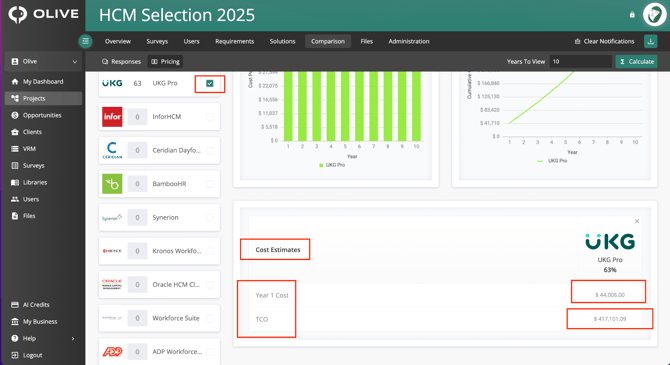
The Cost Estimates table — Year 1 Cost and TCO for each selected vendor
Below the charts, the Cost Estimates table gives you a quick summary of each selected vendor's key pricing figures:
- Year 1 Cost — The total cost for the first year
- TCO (Total Cost of Ownership) — Total spend over the period you've selected
Pricing Details Modal
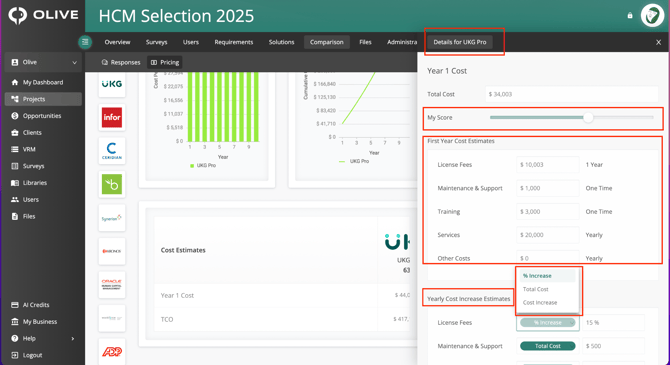
The Pricing Details Modal — full Year 1 cost breakdown, My Score, and Yearly Cost Increase Estimates
To see a full breakdown of a vendor's pricing, click on their Year 1 Cost figure in the Cost Estimates table. The Pricing Details Modal opens on the right with the following information:
- Total Cost — The full first-year cost
- My Score — A slider to rate the vendor's pricing (contributes to their overall evaluation score)
- First Year Cost Estimates — A breakdown by category: License Fees, Maintenance & Support, Training, Services, and Other Costs
- First Year Recommended Changes — Enter your own adjusted cost estimates (in $) for any category
- Yearly Cost Increase Estimates — Set an annual cost increase using % Increase, Total Cost, or Cost Increase, then enter the value
|
💡 Tip: Use the First Year Recommended Changes fields to model a negotiated or adjusted pricing scenario and compare it against other vendors. |
What's Next?
Once you've compared vendors and reviewed pricing, you're ready to move toward a final recommendation. Suggested next steps:
- Finalise scores for all vendors across all requirements in the Responses sub-tab
- Use the Scores tab in the Response Modal to identify and resolve any scoring disagreements in your team
- Flag any unresolved questions as Agenda Items before vendor demos or calls
- Review the Cumulative Cost chart to confirm your preferred vendor's long-term value
- Share your findings with your project team or stakeholders to move toward a decision
Need help? Contact your Olive project administrator or reach out to Olive support.